Sign in
A consolidated, AI-driven view of financial strength across every rated company in this industry — ranked by Economic Capital Ratio, with the causal reasoning behind each score.
Aggregate ECR metrics across every ranked company, by year. Click a point to jump to that year.
Headline figures for this industry and year.
All 27 rated companies in US Spacs, 2022.
| #↑ | Company | Seal | Economic Capital Ratio | Trend |
|---|---|---|---|---|
| 1 |  Codere Online U S Corp Codere Online U S Corp | ★ Top rated | — 0 | |
| 2 | DPCM Capital Inc | ★ Top rated | — 0 | |
| 3 |  Twin Ridge Capital Acquisition Corp Twin Ridge Capital Acquisition Corp | ★ Top rated | — 0 | |
| 4 | Healthcare Capital Corp DE | ★ Top rated | — 0 | |
| 5 | Lazard Growth Acquisition Corp I | ★ Top rated | — 0 | |
| 6 | Kernel Group Holdings Inc | ★ Top rated | — 0 | |
| 7 | Healthcare Services Acquisition Corp | — 0 | ||
| 8 | New Vista Acquisition Corp | — 0 | ||
| 9 | Corsair Partnering Corp | — 0 | ||
| 10 |  Kingswood Acquisition Corp Kingswood Acquisition Corp | — 0 | ||
| 11 | SBEA Merger Sub LLC | — 0 | ||
| 12 | Queen s Gambit Growth Capital | — 0 | ||
| 13 | Poema Global Holdings Corp | — 0 | ||
| 14 | FAST Acquisition Corp | — 0 | ||
| 15 |  Mentor Capital Inc Mentor Capital Inc | — 0 | ||
| 16 |  Infrastructure Energy Alternatives Inc Infrastructure Energy Alternatives Inc | ▼ 11 | ||
| 17 | Millennium Sustainable Ventures Corp | — 0 | ||
| 18 | Pegasus Medical Holdings Inc | — 0 | ||
| 19 |  FCCC INC FCCC INC | ▼ 17 | ||
| 20 | Americrew Inc | — 0 | ||
| 21 | Dongfang CITY Holding Group Co Ltd | — 0 | ||
| 22 |  High Sierra Technologies Inc High Sierra Technologies Inc | ▼ 15 | ||
| 23 |  Sentinel Energy Services Inc Sentinel Energy Services Inc | ▼ 17 | ||
| 24 |  Mountain TOP Properties INC Mountain TOP Properties INC | — 0 | ||
| 25 | WALL Street Acquisitions Corp | ▼ 16 |
How the RealRate model weighs this industry — feature impact, importance, and fit.
The Feature Distribution shows the main industry variables and the distribution of their impact on financial strength. The more important a variable, the broader the distribution. As the effects are calculated relative to the industry average, half of the companies have a positive effect (green) and half have a negative effect (red).
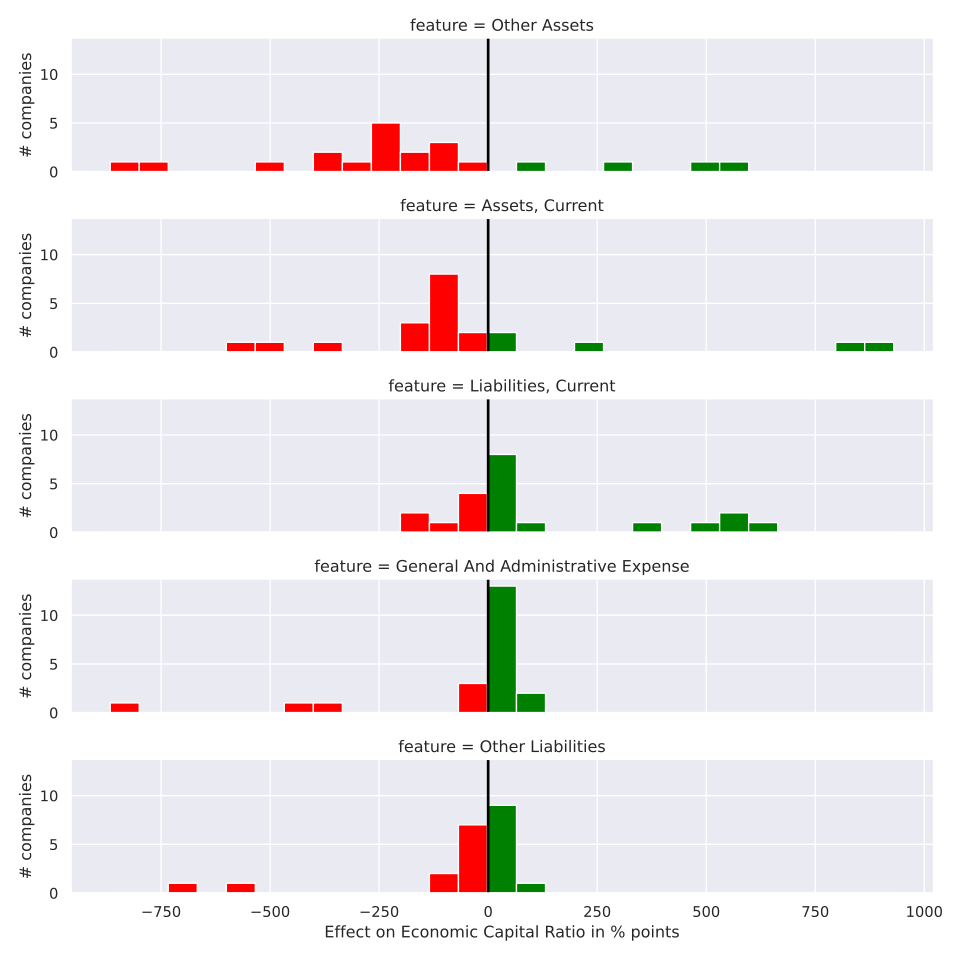
The Feature Importance Graph highlights the most important industry features for the industry. These variables have the greatest impact on financial health, shown as the last variable at the bottom of the causal graph.