
Sign in

Key figures for the selected year.
The model's causal graph for 2024. Inputs synthesize into the Economic Capital Ratio.
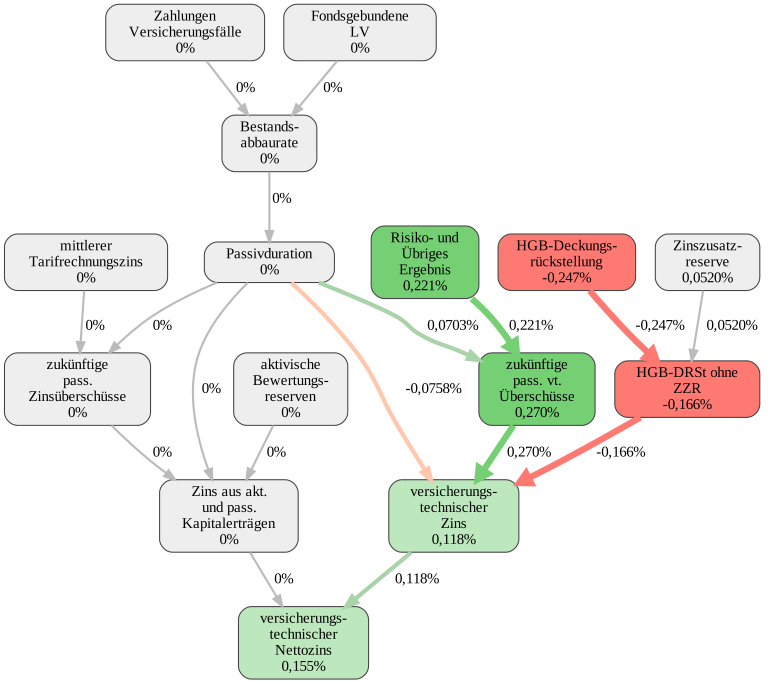
Impact on ECR in % points.
Absolute values from the public annual report, entered into the valuation model.
| Variable | × 1,000 USD |
|---|---|
| Fondsgebundene LV | 3.471.870 |
| HGB-Deckungsrückstellung | 49.217.950 |
| Risiko- und Übriges Ergebnis | 411.794 |
| Zahlungen Versicherungsfälle | 3.500.940 |
| Zinszusatzreserve | 6.387.700 |
| aktivische Bewertungsreserven | -6.545.620 |
| mittlerer Tarifrechnungszins | 2,9% |
| HGB-DRSt ohne ZZR | 42.830.250 |
| Bestandsabbaurate | 7,6% |
Absolute values calculated by the valuation model.
| Variable | × 1,000 USD |
|---|---|
| HGB-Deckungs|rückstellung | -0,247 |
| HGB-DRSt ohne ZZR | -0,166 |
| versicherungs|technischer Zins | 0,118 |
| Zins|zusatz|reserve | 0,0520 |
| Zahlungen Versicherungsfälle | 0 |
| Bestands|abbau|rate | 0 |
| Passivduration | 0 |
| Fondsgebundene LV | 0 |
| zukünftige pass. vt. Überschüsse | 0,270 |
| zukünftige pass. Zinsüberschüsse | 0 |
| Zins aus akt. und pass. Kapitalerträgen | 0 |
| Risiko- und Übriges Ergebnis | 0,221 |
| mittlerer Tarifrechnungszins | 0 |
| versicherungs|technischer Nettozins | 0,155 |
| aktivische Bewertungs|reserven | 0 |
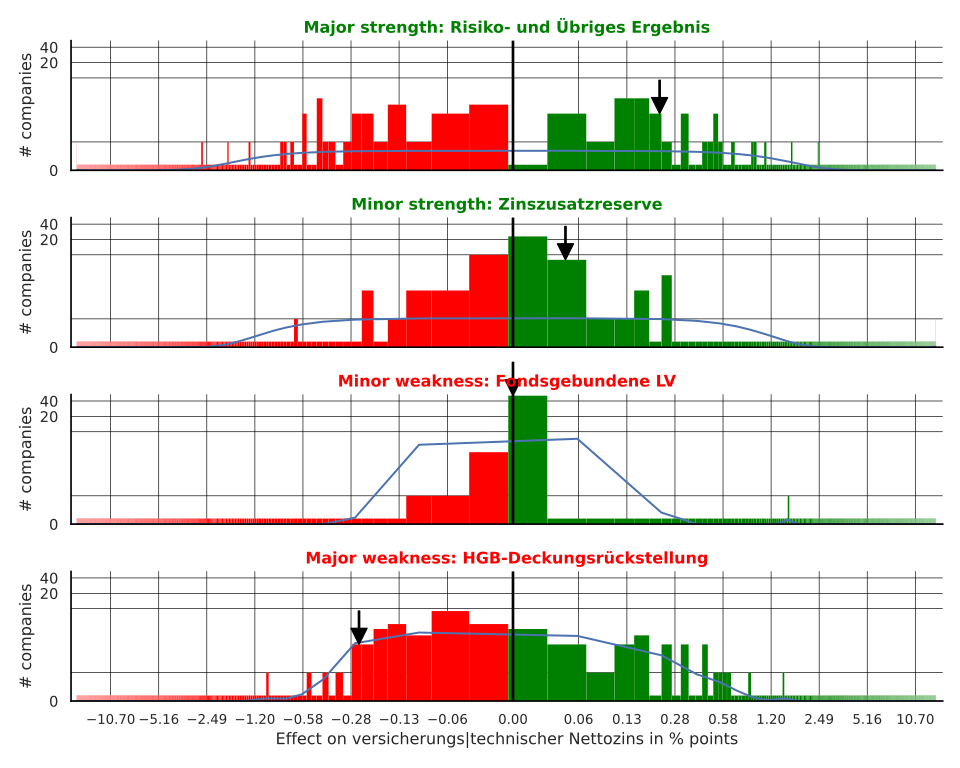
Charts generated by the RealRate valuation model for this report year.
Distribution of each variable's impact on financial strength — green strengthens, red weakens.
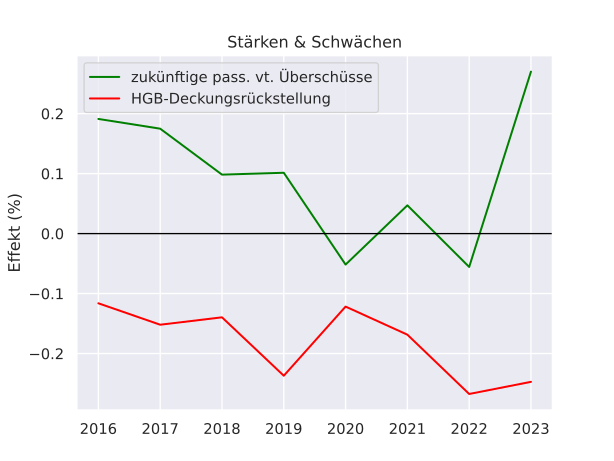
How the company's key drivers have shifted across years.
Model-forecast valuation vs. observed market value.